Histograms
Mystery Detective Worksheets · Grades 6–8 · Interpreting Data Displays
Instant PDF download after checkout. Prefer TPT? It's there too.
Inside the case file
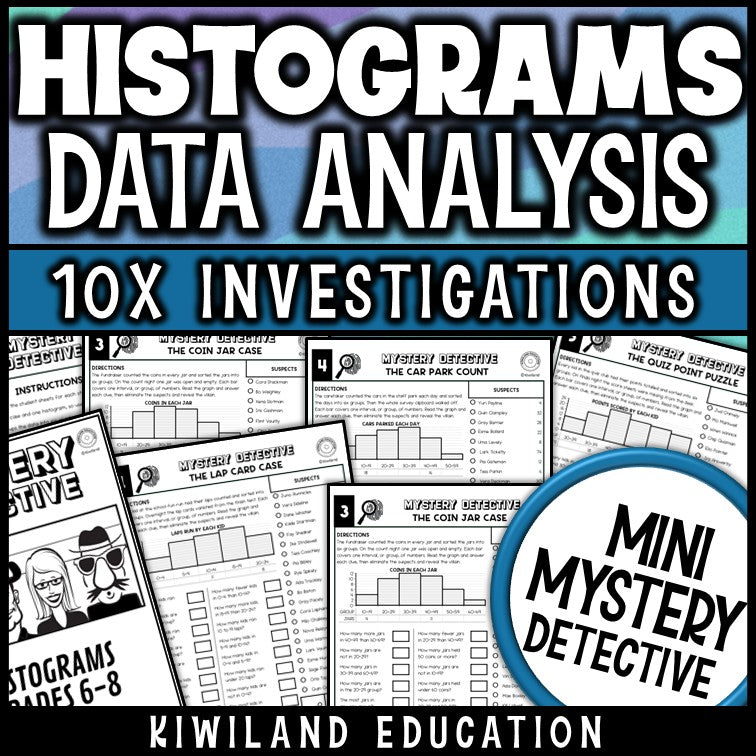
Histogram worksheets, data analysis activities, and reading and interpreting graphs practice for 6th grade, 7th grade, and 8th grade are all included in this set of ten printable Mystery Detectives, perfect for math centers, morning work, early finishers, sub plans, homework, test prep, and end-of-unit review. Students read a histogram, answer the clues, and cross suspects off until one is left standing. Completely no prep - just print and go.
What's Inside
- Reading a frequency straight off a histogram: how many are in the 20-29 group?
- Comparing two intervals: how many more, and how many fewer
- Finding the tallest and shortest interval, and the range between them
- Adding intervals together, and subtracting one from two others
- Cumulative questions only a histogram can ask: how many under 30 minutes, how many 30 minutes or more, how many from 20 to 59
- Reading a whole data set: how many observations are on the graph altogether
- Working out how many are NOT in a given interval
- Reading the horizontal scale: which number does the tallest bar start at
- Completing a frequency table from the graph above it
- Reading a bar that sits between two gridlines on a scaled frequency axis
- Interval widths of 5, 10, 20 and 25, and data sets from 45 up to 250 values
Ten one-page detective cases, each built around its own histogram, with a red-ink answer key for every page.
Built-In Differentiation
The ten cases are a deliberate ramp, so one product covers a mixed-ability class. Case 1 has five short intervals and counts no higher than twelve, with every bar landing exactly on a gridline - workable by a struggling 6th grader. The middle cases widen to six and seven intervals, scale the frequency axis, and start asking students to read a bar that sits halfway between two gridlines. By cases 9 and 10 the intervals are 20 and 25 wide, the numbers run into the hundreds, and the data sets hold 186 and 250 values - genuine 8th grade work.
Hand the early cases to students who need the on-ramp and the later ones to students who need stretching, from the same pack, on the same skill.
What is a Mini Mystery Detective?
A print-and-solve math detective activity - an escape room without the locks. Every answer on the page matches one suspect's ID number, so a correct answer crosses a suspect off the list. Twenty clues eliminate twenty of the twenty-one suspects, and the one left standing is the villain. That makes the whole page self-checking: if an answer matches nobody, the student knows to go back and check their work before they ask you.
The Ten Cases
- The Lap Card Case - laps run at the school fun run
- The Homework Log Job - minutes spent on homework
- The Coin Jar Case - coins counted in every jar
- The Car Park Count - cars parked each day
- The Quiz Point Puzzle - points scored in the quiz club
- The Shell Bag Job - shells in every bag from the beach clean
- The Mileage Mix-Up - miles driven by every car in the fleet
- The Step Count Caper - steps taken on the wall chart
- The Seed Pot Switch - seeds counted in every pot
- The Read-A-Thon Job - pages read by every kid
When to Use This Resource
- Math centers and stations
- Morning work and bell ringers
- Early finishers
- Sub plans and emergency days
- Homework and independent practice
- Test prep and end-of-unit review
- Small group and intervention
Grade Levels
Designed for 6th, 7th and 8th grade. The early cases are also beneficial for advanced 5th graders meeting histograms for the first time, and the later cases work as review for struggling 9th graders in an Algebra 1 statistics unit.
Why Teachers Love Mystery Detectives
- Zero prep - print and hand out
- Self-checking, so students catch their own mistakes instead of queueing at your desk
- The detective hook keeps students working through twenty questions without complaint
- Real rigor - cumulative reading and multi-step interval questions, not just point-and-read
- Answer keys for every case, in red, ready for a marking partner or a display
Building a data and graphing unit? This pack pairs with the Stem and Leaf Plots, Line Plots and Dot Plots, Tally Charts and Frequency Tables, Bar Graphs and Pictographs, and Line Graphs Mystery Detectives.
Love this resource?
Follow Kiwiland Education to discover more Mystery Detectives, data and graphing activities, and detective-themed math for middle school classrooms.